Qualistat 3, a tool for exploiting groundwater quality data.
© BRGM
The need
Over the past fifteen years, major efforts to acquire groundwater quality data have led to a significant increase in the volume of data stored by the Rhine-Meuse Water Agency and in the national database, ADES (Accès aux Données sur les Eaux Souterraines – Access to Groundwater Data). The work carried out by the Rhine-Meuse Water Agency to validate and enhance these data has highlighted the limitations of traditional office automation tools and the need to develop suitable data processing tools and to standardise data processing methods, as well as to develop new decision-making tools. This concerns both the validation and enhancement of the data, in order, for example, to schedule new analysis campaigns or to update the inventory of the Rhine-Meuse basin and the master plan for water development and management (Schéma Directeur d’Aménagement et de Gestion des Eaux – SDAGE).
The results
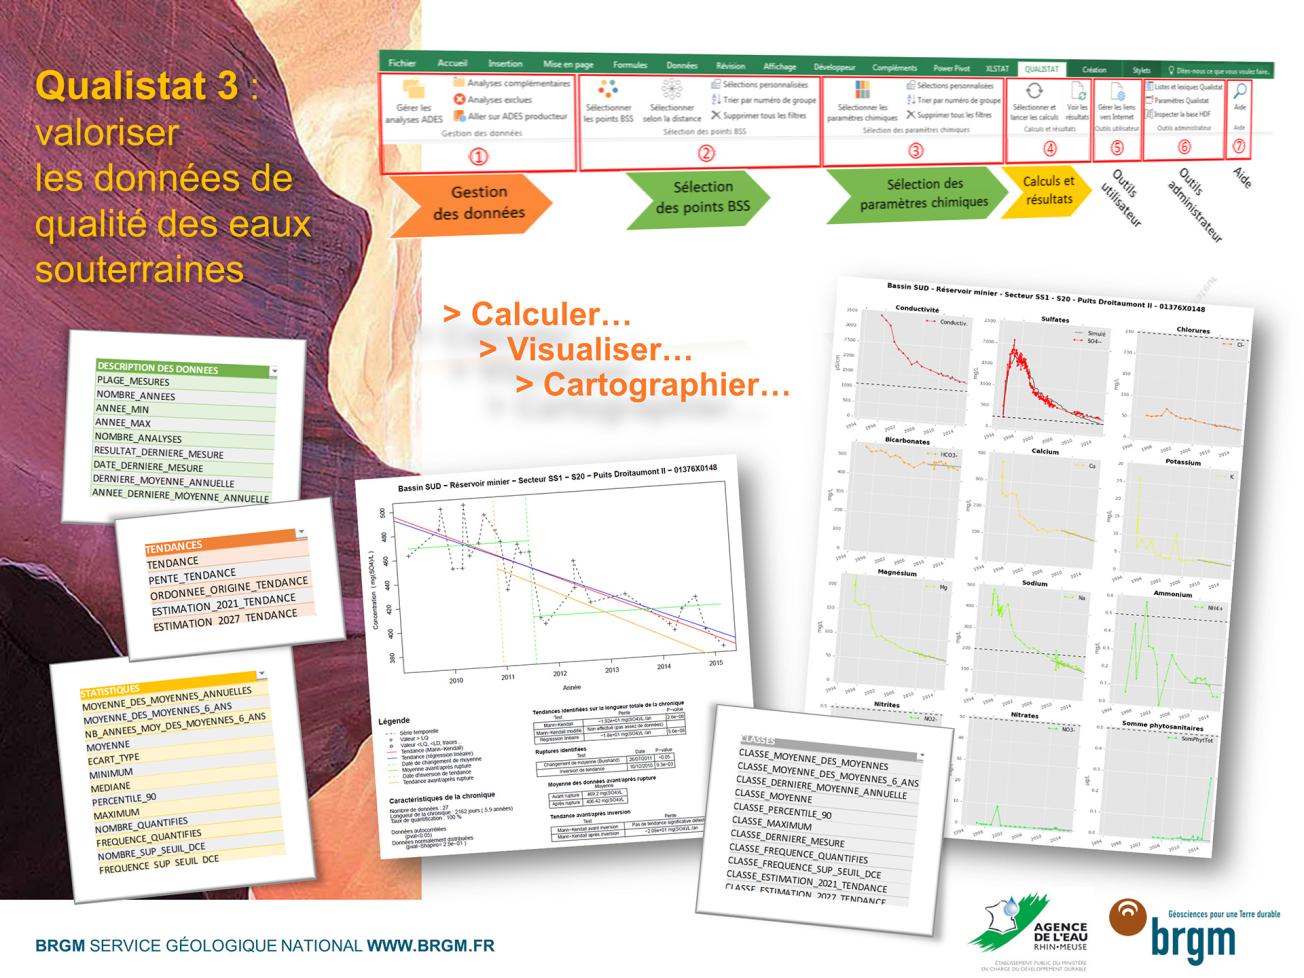
After first organising the input of chemical groundwater analyses available on the Rhine-Meuse basin and their associated metadata, BRGM has been developing a new statistical tool, Qualistat 3, to assist in the validation and valuation of data from the Rhine-Meuse basin, which can automatically process chemical analyses from the national database ADES (Access to Groundwater Data). If they wish, users can also take into account additional chemical analyses that are not stored in ADES. The Qualistat 3 interface enables the user to select water points, chemical parameters and a time period that define a set of chemical analyses to be processed. The user can then launch simultaneously or successively different operations on this set of analyses, such as: extraction of the selected set of chemical analyses, calculation of several statistical indicators, calculation of linear evolution trends by automatic running of the HYPE computation module, plotting of chronological graphs, or calculation of the state of the point according to the national methodology defined according to the European Water Framework Directive (WFD). The user can choose to export simultaneously the results of statistical calculations and the graphs generated, in a variety of formats for later use.
The Qualistat interface was developed in Excel, but calculations and exports are performed seamlessly for the user by a calculation code written in Python and R. Qualistat 3 has been developed to be portable, and can even be installed without administrator rights. Qualistat is modular: a future version could enable the Rhine-Meuse Water Agency to connect it directly to its own information system. Later versions of Qualistat could include additional features for multivariate statistical analysis, classification, modelling of non-linear trends, or the calculation of statistics that take better account of data that fall below the limit of quantification.
Using the software
In 2018-2019, as part of the implementation of the European Water Framework Directive, the Rhine-Meuse Water Agency used Qualistat 3 to prepare a review of the status of the Rhine-Meuse basin. For each water point identified in the basin and for different parameters or groups of chemical parameters, Qualistat 3 automatically produces calculations of relevant statistical indicators, evolution trends and the condition of water points. The Agency directly exploited the results of the calculations in a geographic information system using Qualistat 3 functions to automatically generate the map layers associated with the results.
The partners
Rhine-Meuse Water Agency
