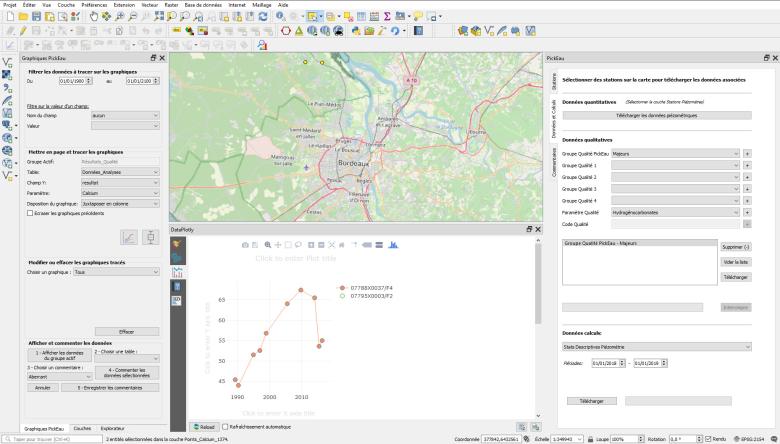
Example of the use of the plugin developed for QGIS, a central point for access to data, processing, graphics and reporting options.
© BRGM
The need
The use of the water data available in national databases, such as ADES and Naïades, was boosted by the implementation of Hub'eau services, which allow data access and downloading by means of Application Programming Interfaces (API's). The user can thus formulate a query with one or more parameters, then collect the results from any tool using a programming language, and possibly using an interface, for example QGIS. This procedure provides very rapid access to the data available in national databases, which are regularly enriched and updated.
However, more often than not, users of water data are not satisfied with just accessing the data and would like to carry out more thorough interpretations: e.g, calculations of monthly averages or trends.
However, there was no service capable of processing or performing calculations on these data, and the methods sometimes available in calculation and interpretation tools were based on the exploitation of a local dataset, which did not allow updating once the extraction had been performed. In addition, users could be led to work with incomplete, inaccurate or imprecise data, which was identified as such, but with no means of making the status of such data public.
It was therefore necessary to make up for these shortcomings by developing services enabling calculations to be carried out on the data in the national databases and the reporting of shortcomings, errors and inconsistencies in these databases.
The results
The PIC'eau project (Harnessing the Collective Intelligence of Water Data) enables these two stages of data processing and feedback to be carried out.
Based on the use and approaches of Hub'eau services, calculation and processing services were developed to allow direct access to calculation results, without the need to download the data beforehand (access to the data remains possible, of course).
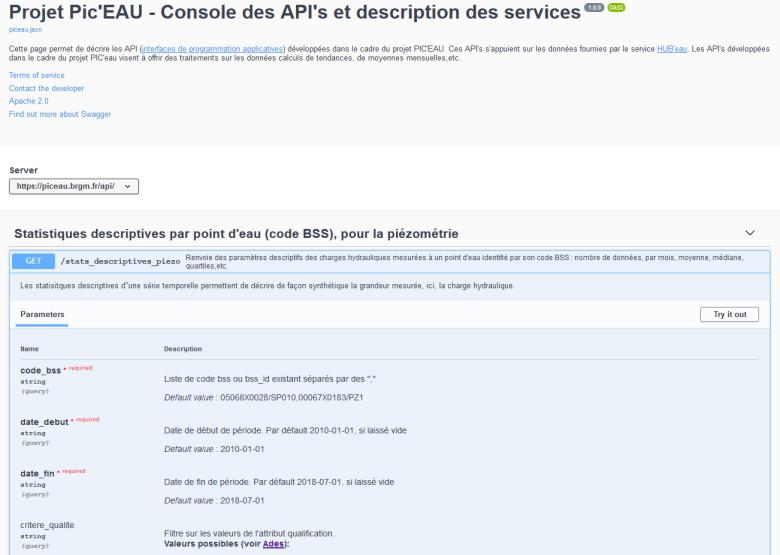
The services are available and documented through API's at https://piceau.brgm.fr, where the user finds a demonstration and testing page and for performing different types of calculations:
- Descriptive statistics of piezometric levels and chemical quality (per parameter), for different periods (the whole chronicle, each calendar month, each year, etc.),
- Trends (piezometric levels and chemical quality) and their significance,
- Periodograms (breakdown of a time series by frequency),
- Autocorrelation of data (on temporal or spatial data series).
For each of these methods, the user can choose specific parameters for the calculations required. Each time one of the services is called, the data are requested from Hub'eau, which ensures that the user has the most complete and up-to-date data available.
Based on free and open-source tools, the solution thus developed by BRGM constitutes a first proof of concept, which can easily be enriched with many other processing functionalities.
In addition, an anomaly reporting service has been created, accessible via an API, but also directly online. Accessible to all, it requires authentication to create or amend reports and allows users to link an observation, a comment, or an additional or corrected dataset to an object that is already available in the national databases. This additional information is stored as an overlay in the national databases and therefore does not change them.
Finally, a plugin for QGIS is being finalised. This additional functionality will allow consultation of the data available in HUB'eau (piezometric data, hydrochemistry), as well as access to processing and feedback services.
Using the results
PIC'eau is a genuinely innovative project still in its experimental stage. Even so, there are many possible uses: studies of a particular site, water body or BDLISA entity, etc. An objective for the following phases is to enable local stakeholders involved in sustainable water management (local authorities, network managers, water boards, etc.) to use these services by facilitating access to water data, for example for monitoring a network (updating monitoring tables based on calculation results).
The partners
- Gironde Département
- Arx'IT (additional developments of the QGIS plugin, industrialisation)
