Summary
    BRGM, the French geological survey, monitors groundwater levels and quality in mainland France.

    In order to monitor groundwater tables, BRGM manages the national piezometric network, which comprises 1,650 boreholes. These enable it to determine in real time the quantitative state of the large aquifers that are exploited. Based on these data, BRGM publishes a groundwater status report to describe the state of the aquifers.

    When will the next BRGM groundwater status report be published?

    Our groundwater report is now published every month, in the middle of the month.

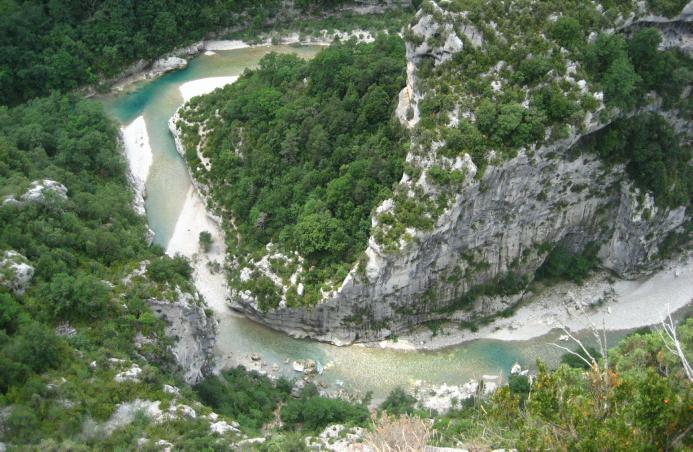
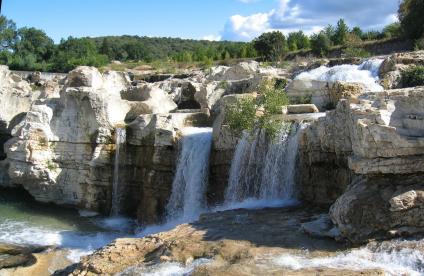
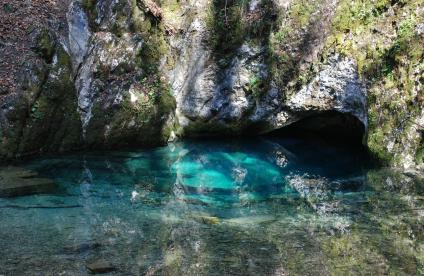
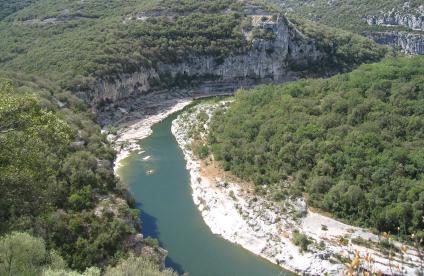
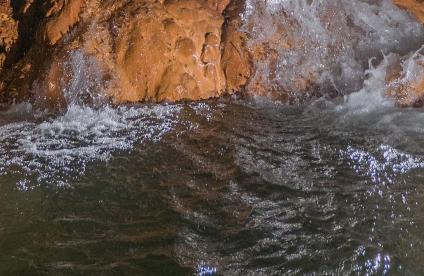
    The resurgences of the cirque of Choranche, Isère

    Groundwater: France's hidden resource

    Groundwater is a widely used resource: in mainland France, it accounts for almost two thirds of drinking water consumption and more than a third of that used for agriculture. It is also widely used in the industrial sector. The aquifers depend on cyclical recharging.
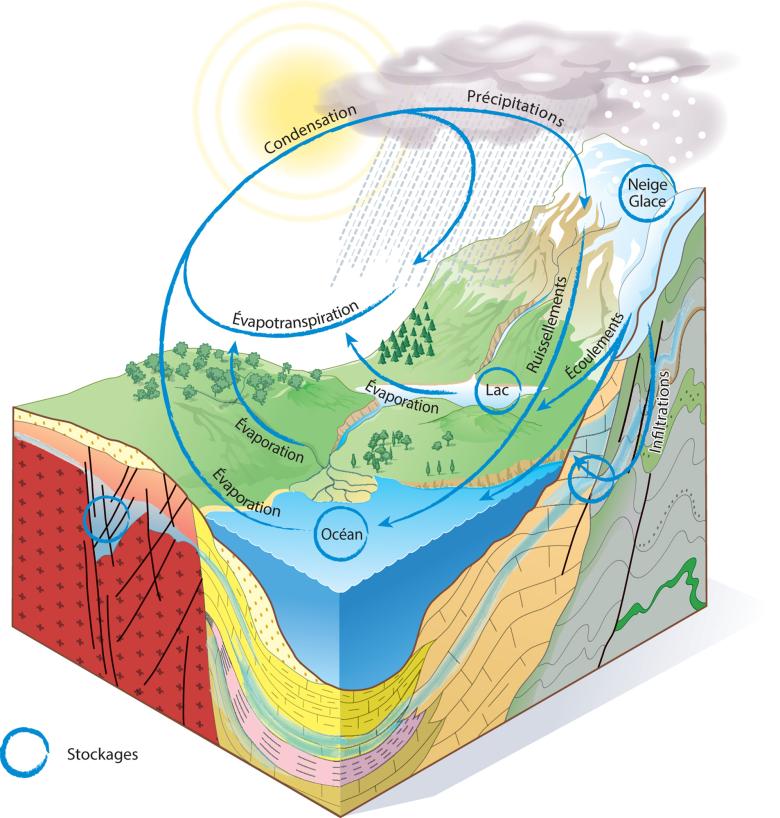
    Diagram of the terrestrial water cycle.

    Diagram of the terrestrial water cycle.

    © BRGM

    There are currently an estimated 100 billion m3, on average, of subsurface water resources in mainland France. About 30 billion m3 of water are abstracted each year for different needs.

    The aquifers are replenished by rain. They are mainly recharged in autumn and winter.

    The water cycle and aquifer recharging

    While some of the precipitation runs off, the subsoil becomes progressively wetter. Part of this water, more than 60% in France, is then redistributed to the atmosphere via evaporation from the soil and transpiration from plants. The remainder seeps deeper into the ground, contributing to the recharge of groundwater reservoirs and "aquifer recharge".

    Groundwater: water contained in rocks

    After the rain has infiltrated the ground we stand on, it circulates in the interstices and cracks of rocks, at varying speeds: this groundwater is called an aquifer (or phreatic aquifer). Aquifers are not, as we might think, underground lakes.

    An aquifer is both a reservoir capable of storing more or less large volumes of water from infiltrated rainfall, and a conducting network allowing underground flows and the progressive emptying of the reservoir towards natural outlets (rivers or the sea).

    An educational animated film about the groundwater cycle. 

    Water evaporates above the ocean and forms clouds. Water then hits the ground when it rains, and sometimes when it hails or snows. Part of this water flows on the ground. Another part infiltrates it. 

    © BRGM / Agence de l'eau Adour-Garonne 

    Water evaporates above the ocean and forms clouds. Water then hits the ground when it rains, and sometimes when it hails or snows. Part of this water flows on the ground. Another part infiltrates it. The water penetrates the top soil. In a few hours, it continues downwards, following spaces between the rock's grains. These empty spaces contain both air and water. This is called an unsaturated zone. When the water hits an impermeable layer, it can't go any further. 

    It accumulates and forms groundwater where the empty spaces between grains fill with water. This is the saturated zone. The water flows horizontally over this impermeable layer, moving a few metres per day towards the lowest point. As long as it rains, the groundwater fills up faster than it is emptied and its level rises. When it stops raining, 

    the level goes down. This is called groundwater drainage. From spring until autumn, even if it rains, evaporation from heat and plants will use up all the water that penetrates the top soil. This water won't go into the groundwater. At the lowest point, it continues to flow into the river. The groundwater level gradually lowers throughout summer and the river flow decreases. Water that enters a porous layer accumulates on the impermeable layer and forms groundwater 

    that flows horizontally. When the water goes underneath an impermeable clay formation, it will flow much more slowly, and its level cannot rise. It is blocked by the impermeable layer above it. In this confined groundwater, the water is under pressure. If we bore through the impermeable layer, water will come up the tube. If there is enough pressure, 

    it will even burst to the surface. This is called an artesian well. In the wild, there is often a superimposition of porous and impermeable layers. These pile up into a kind of tome as is the case in the Aquitaine basin.

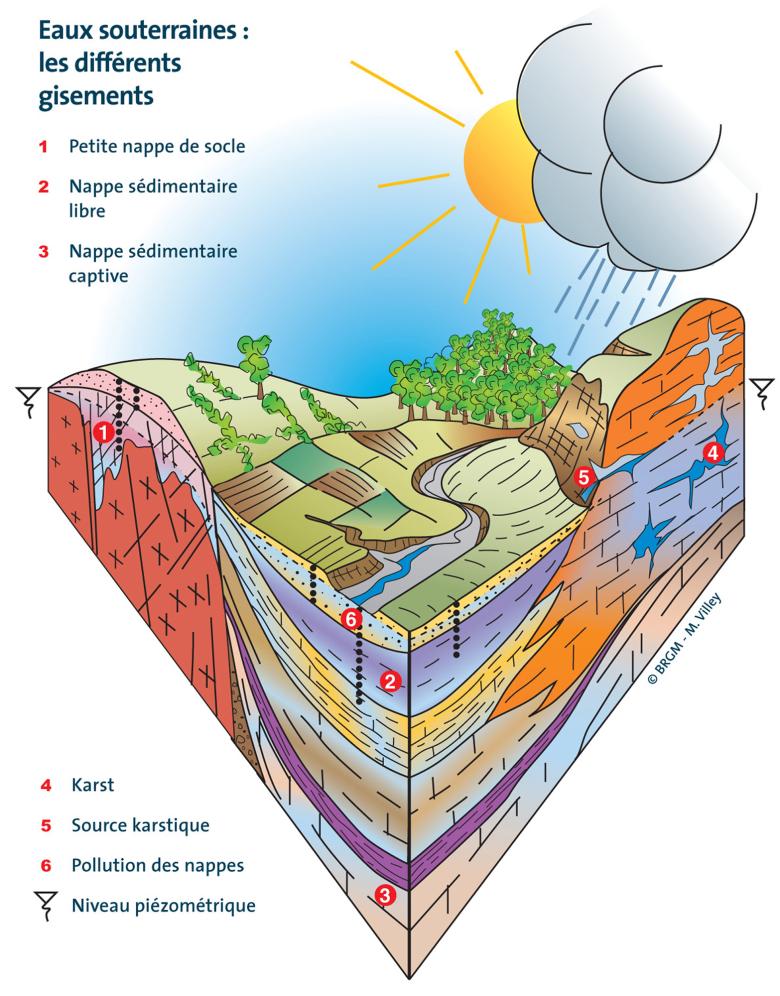
    Diagram on groundwater deposits.

    Diagram on groundwater deposits.

    © BRGM

    Some definitions

    Aquifers and groundwater

    Geological formations that contain a significant volume of exploitable groundwater are called aquifers. An aquifer is a container, the groundwater is its content. Aquifers are not, as some might imagine, underground lakes: the water that circulates in them only occupies cavities in the rock (interstices, cracks, fractures).

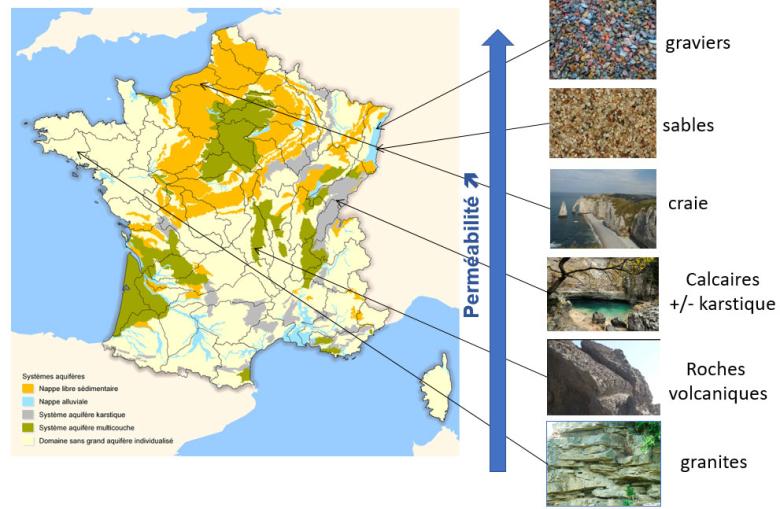
    The main criterion for distinguishing between aquifers and non-aquifers is permeability, a parameter that quantifies the capacity of the geological formation to allow water to circulate. Recent sands (dunes), but also sands deposited by ancient Mesozoic and Cenozoic seas, are very porous and permeable. Limestone and sandstone formations are also very permeable. Such formations can be exploited by drilling wells that can deliver more than 100 m3/h. In some areas (Causses, Quercy, Jura, among others), significant dissolving of the limestone has given rise to karst formations, some of which contain actual underground rivers. Many springs, outlets of the karst massifs, are exploited for drinking water.

    The rocks of the basement domains (granite, gneiss in particular) are characterised by cracks and more or less interconnected fractures. Abstraction rates are generally of the order of a few m3/h and rarely exceed 20 m3/h. This degree of permeability is lower than that of sedimentary rocks.

    Free or confined aquifers

    Among aquifers, a distinction is made between those in which the groundwater is free and those in which it is confined. In the first case, the free surface of the groundwater does not reach the upper level or roof of the aquifer. This roof may be the surface of the ground, in which case it is sometimes referred to as a phreatic aquifer. In the second case, the water table is trapped - captive - under an impermeable roof. It is then under pressure.

    The captive aquifer of the green sands of the Paris Basin falls into the latter category. It is very well known, having been discovered, exploited and studied since the 19th century. It covers 75,000 km2 and contains 400 billion m3 of water according to geological estimates. The precious liquid flows at a rate of 2 metres per year. However, the so-called free aquifers are much more numerous: they account for 85% of the exploitable regional aquifers.

    Two or more aquifers may be superimposed, separated by low-permeability layers. This is known as a multi-layer aquifer. There may be slow but significant exchanges between the different aquifer levels.

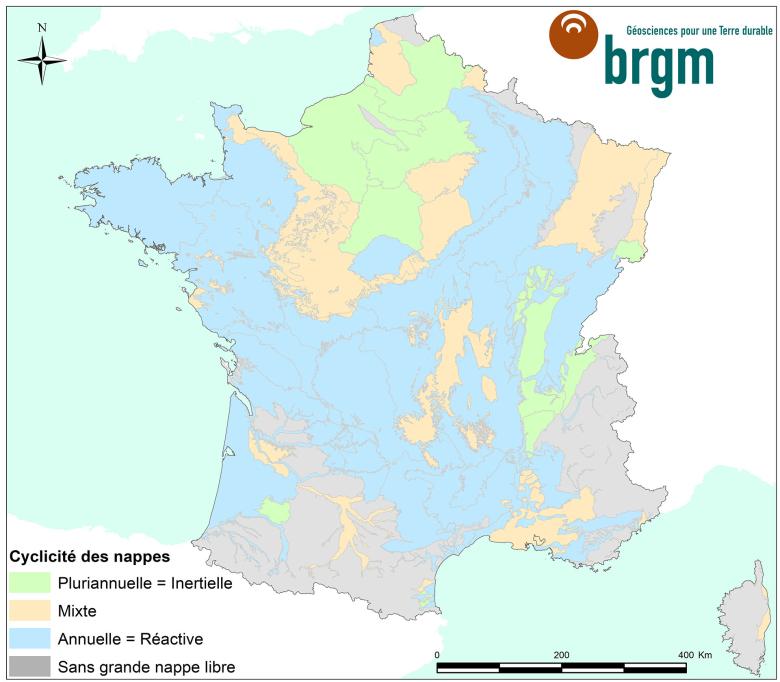
    Cyclicity of aquifers in mainland France.

    Cyclicity of aquifers in mainland France.

    © BRGM

    The winter recharge period: six decisive months

    Groundwater levels vary throughout the year, from high levels in winter (when vegetation does not absorb rainwater) to low levels in summer (the classic discharge period).

    The fate of rainfall varies greatly depending on the time of year and the condition of the ground surface on which it falls. Traditionally, the period of groundwater recharge is from early autumn (September-October) to early spring (March-April), a period during which vegetation is dormant (with low evapotranspiration) and precipitation is normally higher. If the winter is dry, groundwater recharge is very low.

    From spring through summer, rising temperatures coupled with the regrowth of vegetation, and thus increased evapotranspiration, limit the infiltration of rainfall into aquifers. Between May and October, barring exceptional rainfall episodes, groundwater depletion usually continues and levels continue to fall until the autumn.

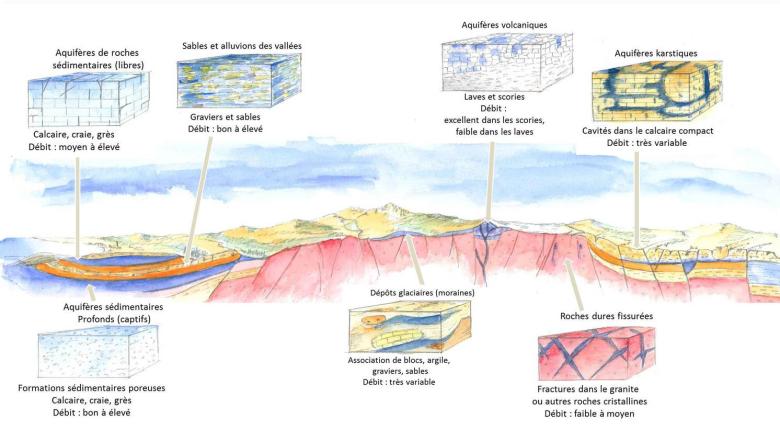
    Diagram showing the different types of aquifers.

    Diagram showing the different types of aquifers.

    © BRGM - Marylène Imbault

    Cyclicity of groundwater recharge: inertial and reactive aquifers

    Groundwater flows at different rates depending on the porosity (percentage of voids in the rock) and permeability (capacity to allow water to circulate, i.e. interconnectivity between these voids) of the aquifers. The larger and more interconnected the voids, the faster the water will flow.

    A given volume of water can travel the same distance:

    • in a few years in a porous environment: the water flows through the interstices in loose rock (sand, gravel) or consolidated rock (sandstone, chalk).
    • in a few months in a fissured environment: the water is contained and circulates in the faults or fissures in the rock (crystalline rock - granite, schist - volcanic rock, non-karst limestone).
    • and in a few days, or even a few hours, in karst environments: the water has dissolved the rock and widened the cracks, creating caverns (karst formations in Cretaceous and Jurassic limestone).

    The impact of the quality of winter recharge differs according to the cyclicity of the aquifer, i.e., its reactivity to rainfall infiltration.

    Inertial aquifers (chalk, tertiary formations and volcanic formations) have a multi-annual cyclicity. Their inertia, characterised by slow flows, allows them to maintain levels that are not very degraded at the end of a winter with a recharge deficit.

    On the contrary, reactive aquifers with annual cyclicity (alluvial, Jurassic and Cretaceous limestone, Triassic sandstone and basement) are very sensitive to a deficit of effective rainfall.

    Entering piezometric data

    How France monitors its groundwater resources
    Over the decades, researchers have developed extensive knowledge of the French subsurface. The country now has a range of measuring instruments that provide a very comprehensive view of the quantitative and chemical status of groundwater. BRGM is responsible for coordinating and exploiting these huge amounts of data.

    Earth sciences are essential for quantitative and qualitative water-management

    BRGM dealt with the issue of water very early on. Since its creation, it has developed internationally recognised expertise in the quantitative and qualitative management of groundwater. BRGM relies on well-founded knowledge of the structure of the subsurface and the characterisation of hydrosystems (resource assessment, understanding of pollution transfers in groundwater).

    Knowledge for management: the contribution of geoscience

    The "hidden" character of groundwater and the great inertia of part of these reservoirs due to the slow flow are the two greatest assets of this resource, guaranteeing access to quality water that is preserved from surface pollution. But these advantages have a downside: the characterisation of the deposits, the understanding of their dynamics and their exploitation are more complex than for surface waters.

    The contribution of geoscience disciplines is indispensable for the acquisition, standardisation and updating of data on geological aquifer formations and protective-envelopes of groundwater. As an expert in subsurface resources, BRGM contributes to the accurate assessment of groundwater resources and to the development of management tools for the various French water stakeholders, such as the water agencies.

    France has 6,500 aquifers, including 200 aquifers of regional importance (with surface areas ranging from 1,000 to 100,000 km2), hosted by various rock formations.

    France has 6,500 aquifers, including 200 aquifers of regional importance (with surface areas ranging from 1,000 to 100,000 km2), hosted by various rock formations.

    © BRGM

    Determining subsurface reserves

    Despite the diversity of its subsurface and the many unknowns, France has very rich databases containing knowledge of subsurface aquifers. They are now managed and developed by BRGM in cooperation with its partners. Approximately 6,500 aquifers of all sizes have been referenced in France, including 200 aquifers of regional scale (from 1,000 to 100,000 km2 in size).

    In order to monitor the level of groundwater, as laid down in the water framework directive, BRGM manages the national piezometric network, which comprises 1,650 boreholes. The latter pierce deep into the subsurface and are used to determine in real time the quantitative state of the large exploited aquifers, since the piezometers (tubes for observing the level of the aquifers) are for the most part equipped with a particular technology (GRPS) which transmits the information remotely. Once or twice a year, technicians visit all the sites to manually check that the data sent by GRPS is consistent with the levels observed on site.

    Monitoring groundwater quality

    In addition, BRGM has made a considerable effort over the last 15 years to couple quantitative water analysis with qualitative analysis. The French Geological Survey thus includes in its measurement network:

    • Tools for measuring groundwater temperature and electrical conductivity. The aim here is to better understand the link between the waters studied and the rise in sea level (with saline intrusions), as well as the exchanges with surface waters.
    • Qualitative analysis tools for pollution risks. In France, companies, local authorities and water agencies have installed no less than 75,000 water-quality meters (distinct from piezometers that measure the level of groundwater) over the country. This enormous mass of information is collected by the ADES portal, developed and managed by BRGM. Its scientists use it to improve understanding of the transport and transformation of contaminants in the soil and then in the aquifers (nitrates, pesticides or emerging pollutants such as cosmetic residues or plant protection products). This work requires the development of new tools that will be able, for example, to "scan" all the pollutants in the water, and thus enable the mobilisation of resources in microbiology, hydrophysics, metrology, but also in analytics and experimentation. In particular, they will enable more accurate groundwater vulnerability maps to be made and the prediction of the impact of land use changes or protective measures on groundwater quality.
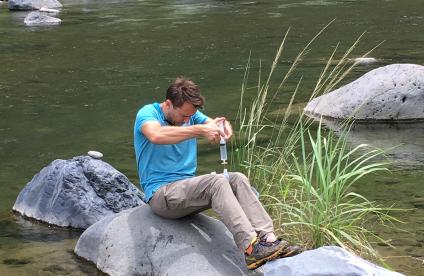
    Taking samples on the Loue river in Vuillafans, Doubs

    FAQ - Frequently asked questions about drought and groundwater

    What is a groundwater table? How are groundwater levels measured? What is a drought and what causes it? What restrictions have been put in place to protect groundwater? Faced with a shortage of water, what solutions should be favoured? Find out the answers to all these questions and more, so you can understand everything there is to know about groundwater.

    Groundwater and its monitoring

    Aquifers are rock reservoirs that contain water. They are geological formations that are sufficiently permeable and porous or cracked to store water and allow it to circulate freely.

    An aquifer is made up of:

    • an unsaturated zone, whose voids contain both air and water. The water percolates down through it;
    • a saturated zone, in which water occupies all the voids, adjusting horizontally to fill the space.

    Groundwater is the water contained in the saturated zone of an aquifer. It is contained in the pores, fractures or cracks of a saturated rock.

    Diagram of the unsaturated and saturated zones of an aquifer.

    Diagram of the unsaturated and saturated zones of an aquifer.

    © BRGM

    Diagram of the unsaturated and saturated zones of an aquifer. © BRGM

    Unconfined or confined aquifers

    A distinction can be made between unconfined and confined aquifers:

    • An unconfined aquifer communicates with the surface of the ground. The water rises and falls depending on the rainfall or lack of it. It is generally shallow (a few cm to 80 m in depth).
    • A confined aquifer is confined between two geological layers of low permeability. The water is under pressure and can gush out in so-called artesian wells. Confined aquifers are often deep. They are replenished from above through their outcropping features or by very slow infiltration through layers that are not very permeable.

    Several aquifers may be superimposed and separated by impermeable layers (clays and marls). Example: Paris Basin and Aquitaine Basin.

    A stack of unconfined and confined aquifers.

    A stack of unconfined and confined aquifers.

    © Eaufrance

    A stack of unconfined and confined aquifers. © Eaufrance

    Inertial aquifers and reactive aquifers

    The reactivity of aquifers depends on their type. It varies according to their porosity (percentage of voids in the rock) and their permeability (capacity to let water circulate, which in turn depends on the size of the fissures connecting these voids).

    • In a porous and permeable aquifer: the water flows through the interstices in loose rock (sand, gravel) or consolidated rock (sandstone, chalk);
    • When an aquifer is in a fissured formation, the water is contained and circulates in the faults or cracks in the rock (crystalline rock such as granite and schist, volcanic rock, non-karst limestone).
    • In a karst aquifer, the water has dissolved the fissures and created and organised channels (karsts in Cretaceous and Jurassic limestone).

    The larger and more interconnected the voids, the faster the water will flow.

    A given volume of water can travel the same distance:

    • in a few years in a porous formation,
    • in a few months in a cracked formation,
    • and in a few days, or even a few hours, in a karst formation.
    The main types of aquifer and corresponding flow rates.

    The main types of aquifer and corresponding flow rates.

    © BRGM

    The main types of aquifer and corresponding flow rates. © BRGM

    We then refer to aquifers that are:

    • reactive (when made up of sand, gravel, karst limestone and weathered granite). These are characterised by rapid reactions: they can recharge during heavy summer rainfall, but are also highly sensitive to drought. Their levels can therefore vary very rapidly over the course of a single season.
    • inertial (when made up of chalk, non-karst limestone, sandstone). Their reactions are slow. Their cyclicity can be multi-annual, meaning that they require a long period to recharge or drain.
    Cyclicity of aquifers in mainland France.

    Cyclicity of aquifers in mainland France.

    © BRGM

    Cyclicity of aquifers in mainland France. © BRGM

    Aquifer recharging

    Before reaching the aquifer, the water has to pass through several barriers:

    • On the surface of the ground: evaporation (which increases as temperatures rise), run-off.
    • In the ground: soil retention (soil moisture), plant water requirements / evapotranspiration (highest in spring and summer when plants are active).
    • In the subsurface: infiltration at depth occurs more or less rapidly depending on the type of rock (more or less porous, cracked or fractured) and the depth of the aquifer.

    Aquifer draining

    Groundwater flows towards its outlets all year round:

    • springs: 71,657 known springs,
    • watercourses: 80 to 100% of their flow can come from aquifers during the summer,
    • wetlands: marshes, ponds, peat bogs, wet meadows,
    • seas and oceans.

    Cyclicity of aquifers

    Aquifer levels vary throughout the year. They are mainly recharged from early autumn (September-October) to early spring (March-April), when temperatures are low (limiting evaporation) and plant activity slows (limiting their abstraction and transpiration).

    From spring through summer, rising temperatures coupled with the regrowth of vegetation and thus increased evapotranspiration, limit the infiltration of rainfall into aquifers. Between May and October, barring exceptional rainfall episodes, aquifer depletion usually continues and levels continue to fall until the autumn.

    The situation varies according to the reactivity of the aquifers, between reactive aquifers, whose state of replenishment will vary rapidly over the course of a single season, and inertial aquifers, whose cycles can be multiannual.

    Groundwater is an essential part of the water cycle, accounting for 30% of the freshwater available on Earth. Today, it accounts for two-thirds of France's drinking water supply, with significant regional variations (up to more than 90% in some départements).

    A few figures

    • 6,500 aquifers in mainland France (each with surface areas of more than 10 km2).
    • 200 regional-sized aquifers (with surface areas between 1,000 and 100,000 km2), of which 175 are unconfined aquifers and 25 confined aquifers.
    • 120 billion m3/year of renewable water (infiltrated rain).
    • 2,000 billion m3 of water in the aquifers.
    • 6 to 10 billion m3/year drawn from aquifers (i.e. 5 to 8% of infiltrated rainfall).

    Not all groundwater resources are well known. There is still a lot to be learned, in particular about:

    • crystalline aquifers, with heterogeneous resources,
    • many karst aquifers,
    • deep or even not so deep aquifers with a ceiling (strategic resources to be protected).

    Despite the diversity of its subsurface and the many unknowns, France has very rich databases containing knowledge of subsurface aquifers. They are now managed and developed by BRGM in cooperation with its partners.

    To facilitate access to knowledge of groundwater and to enable better management of the resource by government departments and local authorities, BRGM has spent the last 10 years working on a vast project to unify data in an evolving repository: the Aquifer System Boundary Database (BDLISA). This is one of the cartographic reference systems in the Water Information System (SIE). It provides a spatial overview of the major groundwater reservoirs in France (mainland France and French overseas departments and territories). This tool can be interrogated and downloaded from the bdlisa.eaufrance.fr website, and is primarily intended for an informed/expert audience. BRGM provides training at its headquarters in Orléans to help with its use.

    The water levels in aquifers are measured with piezometers. These are boreholes through which groundwater can circulate. Some are equipped with a pressure sensor and a remote transmission modem. The instruments are autonomous and send water level data (called "piezometric levels") every day. Others are not equipped and have to be read using a manual sound.

    In France, there are more than 5,200 piezometers (for monitoring water levels in aquifers) and more than 77,000 quality meters (for monitoring water quality), grouped together in more than 300 networks (August 2023 figure), including many local networks. These networks serve a number of different purposes:

    • Knowledge: acquiring knowledge of the quantitative and/or qualitative state of groundwater and a general overview of all or part of an aquifer system.
    • General monitoring: to protect the resource by checking that the groundwater has not been altered by human activities and that it meets the requirements for its various uses.
    • Prevention and warning: alerting people about the occurrence of a risk (flooding due to rising groundwater, deterioration in water quality, etc.) in the immediate vicinity and upstream of a resource (drinking water catchments), a construction (underground tunnel, underground car park) or an area in need of protection.
    • Investigation: finding or characterising an anomaly in groundwater quality or levels. This type of network is used, for example, at or near a polluted site, to identify any impact on groundwater and trace the cause back to its source.
    • Specific monitoring: monitoring the evolution (extension, concentration or levels, etc.) of a pollution plume, a thermal anomaly or overexploitation of an aquifer. It is located above the impacted groundwater and, if necessary, in the immediate vicinity of areas likely to be affected.

    BRGM monitors the national piezometric network. It manages 1,710 water points, including 39 springs (of which 1,650 are equipped for remote data transmission). The piezometers managed by BRGM include 1506 of the 1839 points in the so-called "DCE" network, which ensures that there is enough water to support wildlife at the same time as human needs, as stipulated by the European Water Framework Directive.

    Aquifers beneath a low permeability layer, known as confined aquifers or deep aquifers, have a particular hydrological cycle. The water in confined aquifers is kept under pressure, and the water surface in the reservoir differs from the piezometric surface. Water is released by decompression during pumping.

    Diagram of a borehole in a confined aquifer (left). By drilling through the low-permeability layer, the water rises and can even gush spontaneously to the surface.

    Diagram of a borehole in a confined aquifer (left). By drilling through the low-permeability layer, the water rises and can even gush spontaneously to the surface.

    © BRGM

    Diagram of a borehole in a confined aquifer (left). By drilling through the low-permeability layer, the water rises and can even gush spontaneously to the surface. © BRGM

    Confined aquifers are generally fed by infiltrating water, but only in outcrop areas (areas above which there is no impermeable layer). They can also be fed by drainage of the aquifers surrounding them.

    The water in these aquifers is renewed very slowly: rainwater can take several months to several thousand years to reach the confined aquifers. The piezometric level of these aquifers is often stable but can be strongly affected by water abstraction.

    They are therefore subject to special management, as care must be taken to ensure that the volumes withdrawn do not affect their integrity, given their low recharge rate. Dewatering of a confined aquifer due to excessive abstraction leads to a lowering of the piezometric level below the impermeable layer (reservoir roof). This operation jeopardises the resource both quantitatively and qualitatively.

    This management relies on observation and modelling tools developed by experts to provide precise knowledge of the dynamics of confined or deep aquifers, as a basis for public decision-making.

    Groundwater situation bulletin

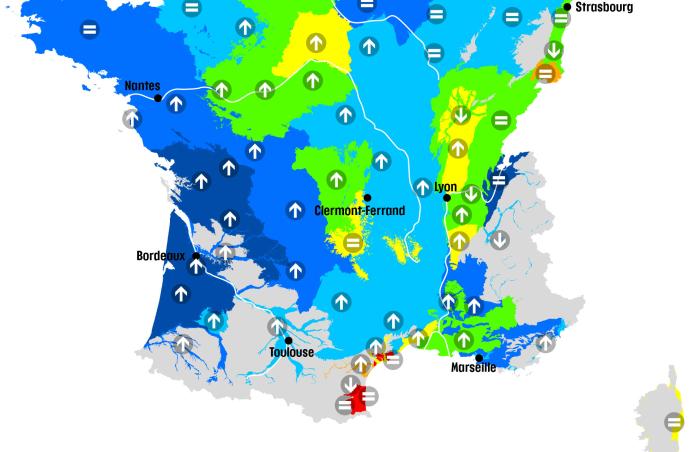
    Based on the data it gathers on aquifers, BRGM publishes its groundwater situation bulletin (BSN - Bulletin de Situation des Nappes d’eau souterraine), every month (in the middle of the month), to describe the state of the aquifers.

    Map taken from the groundwater situation bulletin (BSN).

    Map taken from the groundwater situation bulletin (BSN).

    © BRGM

    Map taken from the groundwater situation bulletin (BSN). © BRGM

    The national groundwater situation bulletin is produced in such a way as to ensure consistency between the production of local groundwater situation bulletins and national bulletins for mainland France, and to guarantee a high level of expertise.

    Data on piezometer levels and spring levels and flows are reported by the data producers at the beginning of each month. For the national bulletin, the various producers, in addition to BRGM, are APRONA, Conseil Départemental de la Vendée, Conseil Départemental des Landes, Conseil Départemental du Lot, EPTB Vistre Vistrenque, Parc Naturel Régional des Grandes Causses, Syndicat Mixte d'Etudes et de Travaux de l'Astien (SMETA) and the Syndicat Mixte pour la protection et la gestion des nappes souterraines de la plaine du Roussillon (SMNPR).

    The data is then consolidated by BRGM or the DREAL for the 7 metropolitan basins: Adour-Garonne, Artois-Picardie, Corsica, Loire-Bretagne, Rhin-Meuse, Rhône Méditerranée, Seine-Normandie. Each aquifer is analysed to determine its trend and overall situation, accompanied by an explanatory text.

    The basin bulletins are then sent to BRGM, which produces the groundwater situation bulletin for mainland France on the basis of the information received.

    The sectors represent unconfined aquifers of interest, i.e. aquifers that are connected to the surface and watercourses and used in particular for drinking water.

    The sectors are delineated based on the groundwater bodies, simplified regions of the national reference system intended for the qualitative and quantitative evaluation of the aquifers. A groundwater body is a regional area representing an aquifer or grouping together several aquifers that are connected hydraulically. Their delineation is based mainly on geological and hydro-geological criteria.

    The water bodies have been grouped together according to their lithostratigraphy (type and age of the aquifer rock) and then subdivided according to the dominant cyclicity of the water bodies and monitoring piezometers. The sectors thus delimited are representative of an aquifer with homogeneous hydrogeological behaviour and are displayed on a map of France.

    The same aquifer is measured at several points and its level may vary slightly from one point to another. The Groundwater Situation Bulletin (BSN - Bulletin de Situation des Nappes) map shows global indicators at the sector scale, reflecting trends and average situations. The global indicators are based on indicators that are read at groundwater level monitoring points (by means of piezometers).

    Piezometers were selected in each sector according to the following criteria:

    • They must be representative of the hydro-geological functioning of the sector. In particular, so-called "influenced" piezometers are excluded, i.e. those subject to the influence of a nearby watercourse or pumping station, and therefore not representative of the actual level of the aquifer.
    • There must be at least 15 years of data for them, which is essential for calculating the indicators.
    • They must be permanent and equipped with remote transmission equipment.

    We also checked that there were enough piezometers to be representative for a given sector, depending on the hydrogeological context, and that they were evenly distributed throughout each sector.

    For each sector, situation and trend, indicators are calculated for the piezometers for the month in question. These indicators are then averaged across the sector to calculate its overall situation and trend indicators.

    These overall indicators reflect an average condition, which can sometimes mask contrasting local situations. However, BRGM has chosen to make the map more readable on a national scale and to show only the general state of each aquifer. Consequently, not all of the piezometers used to calculate the sectors are displayed.

    The "Aquifer level" indicator compares the average level of an aquifer for the current month with its average for the same months in previous years (over at least 15 years, and sometimes up to more than 100 years). In other words, it allows us to compare the average monthly piezometric level to those of the series as a whole, and therefore to calculate the deviation from the norm. It is divided into 7 classes, from the lowest level (in red) to the highest (in dark blue).

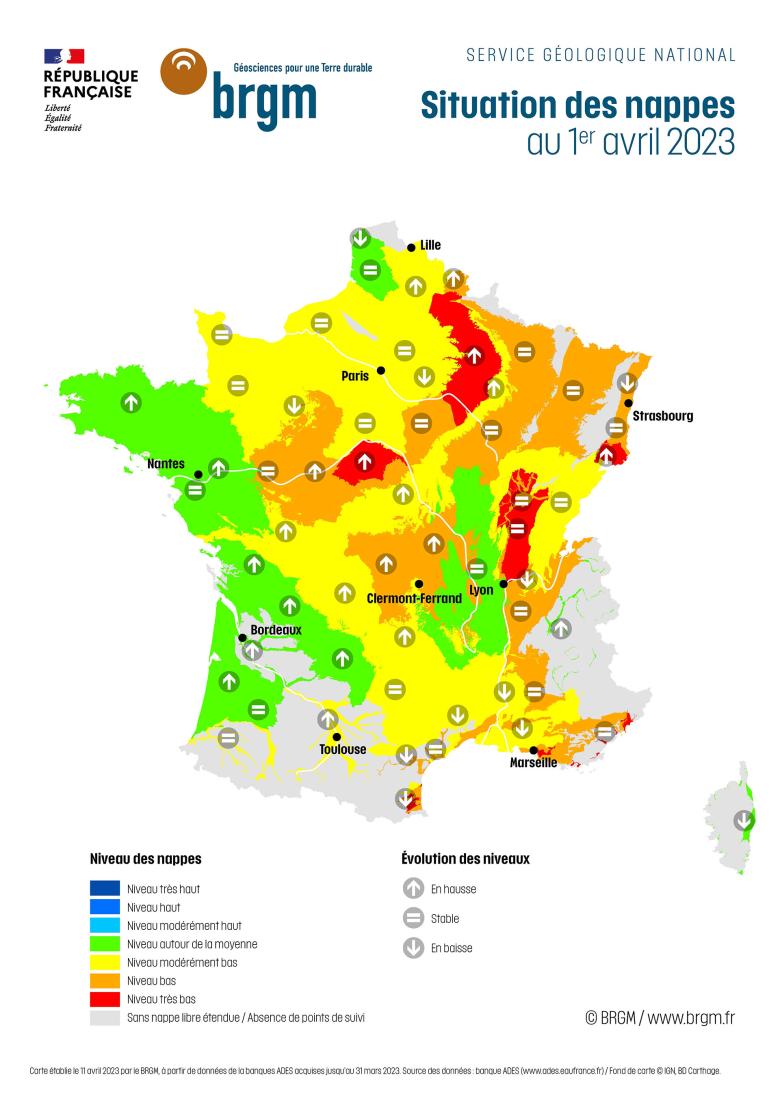
    The legends for the "Aquifer level" indicator of the map come from the Groundwater Situation Bulletin (BSN) map.

    The legends for the "Aquifer level" indicator of the map come from the Groundwater Situation Bulletin (BSN) map.

    © BRGM

    The legends for the "Aquifer level" indicator of the map come from the Groundwater Situation Bulletin (BSN) map. © BRGM

    Prior to 2017, the calculation method used to assess the groundwater situation was based on the return time for an aquifer. However, this calculation method has shown certain weaknesses, particularly in the case of aquifers with multi-year cycles and aquifers showing an upward or downward trend over several years.

    Since January 2017, changes in aquifer levels have been determined using the Standardised Piezometric Indicator, known as IPS (Indicateur Piézométrique Standardisé). This indicator is consistent with the indicators used by Météo-France, such as the Standardised Precipitation Index (SPI) and the Standardised Soil Water Index (SSWI).

    To find out more about the Standardised Piezometric Indicator (IPS):

    The ‘high’ or ‘low’ levels correspond to a comparison with monthly norms, and not to a comparison between the aquifer level and abstraction requirements.

    The grey-shaded areas on the groundwater situation bulletin (BSN) map are areas where there are no extensive unconfined aquifers and/or no monitoring points. They correspond to three possible cases:

    • areas without an unconfined aquifer, i.e. with a formation layer of low permeability or semi-permeability above the aquifer (confined water table);
    • sectors with a large number of small and poorly connected aquifers, which would be illegible on the map (e.g.: South-West – upstream of the Garonne, an area where many abstractions are also taken from surface watercourses);
    • in mountainous areas, where the aquifers are too heterogeneous: they react very differently from one another depending on the local geology and rainfall. There are then no aquifer monitoring points (piezometers), but the springs are monitored by the local authorities (DREAL).

    It is not possible to distinguish between these different cases on the map, as the grey areas often cover more than one case.

    Map taken from the groundwater situation bulletin (BSN) with the grey-shaded areas ringed.

    Map taken from the groundwater situation bulletin (BSN) with the grey-shaded areas ringed.

    © BRGM

    Map taken from the groundwater situation bulletin (BSN) with the grey-shaded areas ringed. © BRGM

    The "Change in level" symbol indicates the variation of the water level of the month in question compared to the two previous months (stable, rising or falling). It shows whether the water table is recharging (rising) or depleting (falling).

    The legends for the "Changes in level" indicator come from the Groundwater Situation Bulletin (BSN) map.

    The legends for the "Changes in level" indicator come from the Groundwater Situation Bulletin (BSN) map.

    © BRGM

    The legends for the "Changes in level" indicator come from the Groundwater Situation Bulletin (BSN) map. © BRGM

    Groundwater is continuously discharged into natural outlets: rivers, wetlands, springs, the sea and oceans. Abstractions from aquifers are also considered to be water outflows. If the rainfall infiltrated at depth is sufficient to compensate for these outflows, levels rise and the aquifer is recharged. On the other hand, if the rainfall infiltrated at depth is less than the volumes of water leaving (natural outlets and abstractions), levels fall and the aquifer empties. Stable levels indicate that there is an equilibrium between water inflow and outflow.

    Extract of aquifer levels from the situation map on 1 June 2023.

    Extract of aquifer levels from the situation map on 1 June 2023.

    © BRGM

    Extract of aquifer levels from the situation map on 1 June 2023. © BRGM

    On the BRGM groundwater situation map, the colours (‘Aquifer level’ indicator) and the symbols (‘Changes in aquifer levels’ indicator) are not on the same time scale and do not represent the same thing:

    • The colours represent the aquifer levels compared with averages for the same month over at least 15 years, and up to more than 100 years in some cases. The colour shows whether the water table is above or below normal for the time of year.
    • The symbols represent changes in aquifer levels. The symbols show whether the water table has been recharged or drained over the last two months.

    It is thus quite possible to have an aquifer whose ‘level’ indicator increases from one month to the next even though its ‘changes in level’ indicator has dropped.

    For example, aquifers usually drain between April and May. In May, aquifer levels are therefore normally lower than in April.

    • If the aquifer has a downward arrow in May, this means that it was draining.
    • If the rate of draining is the same as usual, the colour on the map should remain the same. If, for example, the aquifer’s colour turns from yellow to green, this means that it has drained less quickly than usual.

    Each month, Météo-France produces a bulletin of major trends for the next three months. It is not a forecast to provide information on the expected weather in France on a given day, but an indication of likely trends on the European scale. BRGM uses these forecasts to produce a projection of the state of aquifers, which is included in the monthly groundwater bulletin.

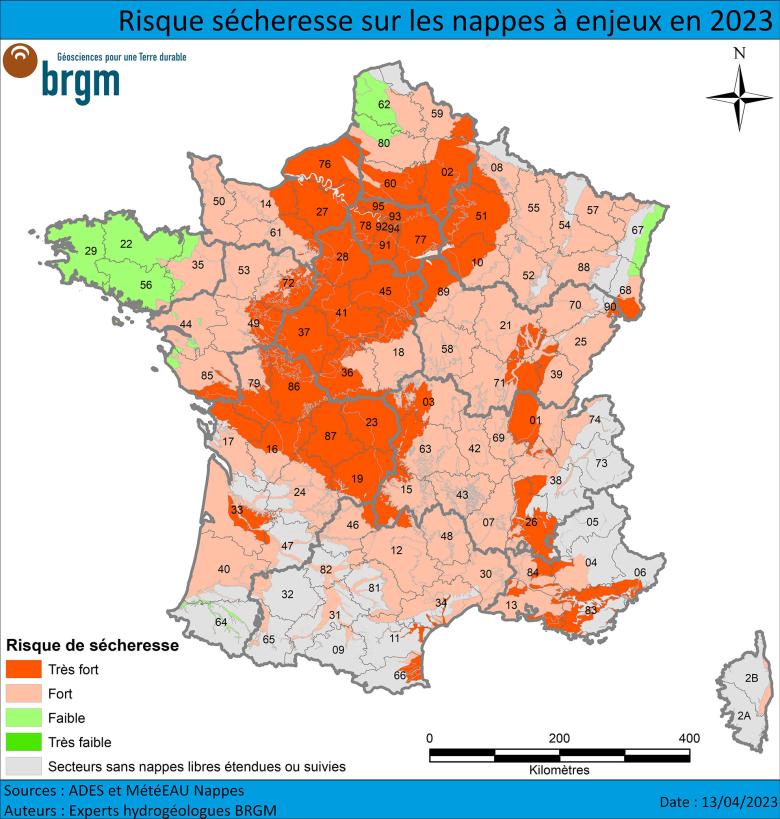
    In addition, since 2021 BRGM has been producing a map of summer forecasts on the condition of aquifers. This map is published each spring as part of the Groundwater Situation Bulletin (BSN).

    The drought-risk map is based on the initial state of the aquifers after the winter recharge period, on seasonal forecasts from Météo-France, on seasonal forecasts from hydro-geological models and also on the expert appraisals of BRGM regional hydro-geologists.

    Example of a summer drought risk map.

    Example of a summer drought risk map.

    © BRGM

    Example of a summer drought risk map. © BRGM

    There are two types of aquifers:

    • inertial aquifers, with multi-annual cyclicity, characterised by slow flows,
    • and reactive water tables, with annual cyclicity, which recharge and drain more quickly.

    Reactive aquifers are very sensitive to the presence or absence of effective rainfall. When a period of low rainfall is expected, it is thus normal for a reactive aquifer to be in green (aquifer level ‘around average’ in the groundwater situation bulletin) and at high risk of drought (according to the seasonal forecasts drawn up by BRGM for the summer period).

    Other groundwater data

    Data from the piezometric network is available on the ADES website (Accès aux Données sur les Eaux Souterraines).

    ADES is a free, open-access groundwater database. The site does not list all the existing water points, but only certain structures that are part of a network and are therefore monitored for quality (analysis of raw water) or quantity (water levels).

    In August 2023, the ADES database provided data for more than 300 declared networks containing more than 80,000 water points, including more than 5,200 piezometers (with level monitoring) and more than 77,000 quality meters (with quality monitoring).

    There is no "discrepancy" as such between BRGM's groundwater situation bulletin (BSN) and the hydrological situation bulletin (BSH) as far as aquifer level indicators are concerned.

    The BSN focuses solely on the state of aquifer levels at the national level (mainland France).

    The national hydrological status report consists of a set of maps with corresponding comments that show the monthly evolution of water resources. It describes the quantitative situation of aquatic environments (effective rainfall, river discharge, groundwater table levels, reservoir-dam filling status) and provides summary information on Prefectural Orders issued to limit water use during the low-water period.

    BRGM contributes to the groundwater section of the French Hydrological Status Report.

    Hydrological bulletins since 1998 are available online.

    The hydrological cycle and geological context are very different for each DROM in comparison with mainland France. It would thus be too complicated to cover them all in a single bulletin.

    There are groundwater monitoring bulletins for overseas France, some of which are available on the DEAL or water observatory websites:

    Drought

    There are 3 types of droughts, which are generally cumulative:

    •  Meteorological drought, which corresponds to a prolonged shortage of rainfall.
    •  Soil drought, which results from a lack of water available in the ground for plants, which affects all plant production, and indirectly animal production.
    •  Hydrological drought, which refers to a shortage of available water resources, both surface water (rivers, lakes, reservoirs) and groundwater (aquifers).

    A shortage of available water resources can be caused by a number of factors:

    • Lack of precipitation, preventing the replenishment of water reserves. This is all the more important if it happens several years in a row and if the episodes are repeated.
    • High temperatures that encourage water evaporation, which can exacerbate drought by increasing the demand for water from plants, and reducing the supply of water to soils and reservoirs.
    • Excessive use of water: when demand for water exceeds availability, water reserves can be depleted.

    Not all droughts are necessarily due to climate change. However, the recurrence of extreme events (including droughts, but also very intense rainfall, extreme heat, etc.) is a strong marker of climate change.

    Climate change is making droughts more frequent, more intense and longer-lasting:

    • On the one hand, rising temperatures increase the evaporation of water from soils, rivers, lakes and reservoirs, as well as the water needs of plants (which increases the demand for irrigation). In recent years observations show that the groundwater recharge period is shortening, due to rising temperatures, with vegetation being active later in the autumn and earlier in the spring, which means that rainfall is unavailable for recharging. All this exacerbates drought and affects aquifer levels in particular.
    • Furthermore, rainfall patterns are changing: some regions may experience a decrease in rainfall, which reduces recharging and water availability, and worsens the drought. Other regions may experience more intense rainfall concentrated over short periods, leading to flooding, followed by periods of drought.

    The Explore 2070 project, which ran from 2010 to 2012 and involved BRGM, assessed the possible impact of climate change on aquifer levels and recharging between now and from 2050 to 2070 in mainland France and the French overseas départements, compared with a baseline situation (1961-1990). This assessment projected:

    • a reduction in recharge of between 10 and 25%,
    • a drop in the average monthly level of aquifers linked to the drop in recharge, which is very limited on the alluvial plains (thanks to river recharging), but which is significant on the plateaux or foothills of the sedimentary basins.

    It should be noted that this approach is currently being updated with the Explore 2 project, which began in 2021 and is due to end in 2024.

    The long-term downward trend in groundwater levels is due to multiple factors. In addition to the influence of climate change, it may also be due to the impact of human activity on aquifer recharging (soil sealing, etc.) and to greater demands on groundwater (aquifer abstraction).

    First of all, we need to distinguish between soil drought (which can stop almost instantly) and aquifer drought.

    One of the biggest misconceptions about drought is that rain is enough to end a drought. That is not true.

    Several phenomena concur to maintain the risk of drought despite recent rainfall:

    • Groundwater reserves are recharged mainly in winter, when vegetation is dormant. Outside this period, rainfall is generally not effective in recharging the aquifers. From spring onwards, trees and plants use rainfall for their growth: the vast proportion of water is taken up before it can reach the aquifers.
    • When it rains heavily, a significant amount can evaporate or run off quickly at the surface, without entering underground water reserves. If the ground is very dry, the water will run off and this can also cause flooding, but there is little infiltration into the aquifers.
    • Water deficits accumulated over time often require prolonged and regular rainfall to be made up. A series of rainy seasons may be necessary to replenish water reserves that have been depleted during periods of drought.
    Average fate of rainwater over an annual cycle.

    Average fate of rainwater over an annual cycle.

    © Jean-Jacques Collin, Les eaux souterraines, 2004

    Average fate of rainwater over an annual cycle. © Jean-Jacques Collin, Les eaux souterraines, 2004

    Summer rainfall events can, however, have certain positive impacts:

    • Although rainfall does not directly contribute to recharge, it does relieve aquifers by reducing the need to draw water for irrigation, since it benefits vegetation.
    • Rainfall can have an episodic impact on reactive aquifers (aquifers with annual cyclicity, that are very sensitive to the presence or absence of effective rainfall), without however modifying the overall trend. Changes in aquifer trends occur either during the recharge period or during sustained rainfall events (rather than one-off storms).

    There are several types of impact from low aquifer levels.

    Impact on surface water and the environment

    Under normal circumstances, groundwater naturally drains into watercourses, helping to sustain their flows during low-water periods. Eighty to one hundred percent of their flow can come from aquifers during the summer. If the aquifer levels are very low, they cannot play this role. This results in:

    • A drop in low-water flows in watercourses and an increase in the duration of dry periods (the period during which a river has no water).
    • Possible drying up of springs and risk of degradation of wetlands.
    • Impacts on the flora and fauna associated with these environments and on the landscape.

    Quantitative impact on abstractions

    The fall in water levels in the aquifers can have an impact on water abstraction: causing a risk of supply disruption, conflicts between users of drinking water, energy, irrigation, industry, leisure activities and also civil defence (fire-fighting).

    Deterioration of water quality

    The lower the flow rates, the more contaminants will be concentrated. Furthermore, dewatering, or the lowering of the water table, can also lead to changes in geochemical conditions that are detrimental to water quality.

    In coastal areas: risk of saline intrusion

    This phenomenon refers to the entry of salt water into coastal aquifers as a result of the change in hydraulic balance between the denser salt water in the sea and the fresh water that ‘floats’ on the salt water. The boundary between the two environments (interface) takes on a wedge-shaped profile known as a salt wedge. Salt water penetrates groundwater over a distance that varies from one area to another and can exceed one kilometre, with impacts on water quality in estuaries, marsh areas and coastal aquifers. This is what is feared today for the Roussillon aquifer, on the coastal edge of the Pyrénées-Orientales département.

    In 2022, all of France's aquifers were affected by drought. All water resources were also affected, with meteorological drought (rainfall deficit), soil drought and hydrological drought affecting surface water, dams and reservoirs, as well as groundwater.

    In 2023, there is a more contrasted situation. This year, 2023, follows a year of severe drought in 2022, which affected the whole of mainland France, and was followed by a winter in 2022-2023 with uneven recharges that had little impact, across the country. This sequence of events can give rise to exceptional local situations.

    Groundwater abstraction

    Virtually all aquifers are exploited. However, there are exceptions:

    • Not all deep aquifers (Paris Basin and Aquitaine Basin) are tapped: their salty (due to salts from geological formations) and warm water means that it is not immediately suitable for drinking and that it favours corrosion. The cost of exploiting them would be too high.
    •  Water Distribution Zones (ZRE - Zones de Répartition des Eaux) are areas in which water resources are chronically insufficient to meet user needs. These areas are therefore protected, i.e. abstraction (of surface water and/or groundwater) is limited.
    Map of water distribution zones (ZREs) in 2018.

    Map of water distribution zones (ZREs) in 2018.

    © DREAL, DRIEE - Sandre

    Map of water distribution zones (ZREs) in 2018. © DREAL, DRIEE - Sandre

    In France, water resources are unevenly distributed. In some regions, there is not enough water to meet the population’s needs, whether or not there is a period of drought. This chronic shortage of water resources may be due to two factors which, in some cases, are combined:

    • few naturally available water resources,
    • particularly densely populated areas.

    The water distribution zones (ZREs) are geographical areas which meet these criteria. The inclusion of a resource (river basin or aquifer system) in a ZRE is a way for the government to ensure more detailed management of requests to draw water from the resource, by lowering the thresholds for declarations and authorisations to draw water. It signals clearly that there is a long-term imbalance between water resources and needs. Lowering the thresholds for authorisation and declaration of water abstraction means that we can now control water abstraction on the basis of in-depth knowledge, which helps us to reconcile the economic development of water resources with the protection of aquatic ecosystems.

    For the moment, there are only a few aquifers where we can clearly state that there is a deterioration in the level of water over a long period. These include, but are not limited to, the following:

    • The Nouvelle Aquitaine region, for the Adour Garonne basin (Eocene, Oligocene and Cretaceous aquifers and their recharge areas, basins such as the Upper Adour and Dordogne [from its confluence with the Tournefeuille stream to that of the Isle river), the Vézère river from its confluence with the Cert, Isle, Dronne, the Charente, the Seudre and the coastal rivers of the Gironde estuary] and for the Loire-Bretagne basin (the Cénomanien aquifers and the Vienne basin aquifers between the Blourde and Creuse confluences, the Clain, Thouet, Sèvre Niortaise, Envigne, Ozon and Curé canals basins).
    • The Centre-Val de Loire region (Beauce, Cénomanien and Albien limestone aquifers).
    • Occitanie region (the Roussillon aquifers).
    • The Hauts-de-France region (Carboniferous aquifer north of Lille).
    • The Rhône-Méditerranée basin.

    In other sectors, BRGM is called upon to provide information for future decisions to classify rivers as ZREs.

    First of all, we need to distinguish between water abstraction and consumption:

    • The French database of water abstractions (BNPE - Banque Nationale des Prélèvements quantitatifs en Eau), a national tool for keeping track of water abstractions, provides information on abstractions by use and by type of resource (surface water, groundwater, seawater).
    • Some of the water abstracted is not returned to the aquatic environment after use. It is then considered to have been consumed (we can also talk about net abstractions, i.e. minus restitution). This share, which is estimated, varies greatly depending on the use.

    At the national level, the sources of water abstraction (all types of water resources combined) break down as follows (BNPE 2020 figures, in descending order):

    • Turbined water (dams): 666 billion m³ of abstractions, exclusively from surface water. This activity does not consume water but only retains it.
    • Energy: 18 billion m³ of abstractions, the vast majority from surface water (74.2%) or coastal water (25.5%), with only 0.3% from groundwater. Only part of the water withdrawn is consumed, the part used to cool nuclear power plants equipped with cooling towers (for these plants, the water does not return to the water cycle in liquid form, but as steam).
    • Drinking water: 5.6 billion m3, 65% of which comes from groundwater, 34.7% from surface water and 0.3% from desalinisation of seawater.
    • Feeding canals: 5.3 billion m³, 99.7% of which comes from surface water and 0.3% from groundwater.
    • Irrigation: 3.4 billion m³, 58% from surface water and 42% from groundwater. It should be noted that irrigation water does not return to groundwater, except in the specific case of grassland irrigation, as in the Crau basin, where it is precisely thanks to this return that aquifer levels are sustained.
    • Industry and other economic activities (excluding irrigation and energy): 2.7 m3, 64% from surface water, 29% from groundwater and 6% from sea water.

    Groundwater abstraction breaks down as follows (BNPE 2020 figures, in descending order):

    • Drinking water: 3.68 billion m³, or 61.2% of the total.
    • Irrigation: 1.45 billion m3, or 24.2% of the total.
    • Industry and other economic activities (excluding irrigation and energy): 820 billion m³, or 13.6% of the total.
    • Energy: 47.9 billion m3, or 0.8% of the total.
    • Feeding canals: 13.8 billion m3, or 0.2% of the total.

    These figures are also available at regional, departmental and municipal levels. Uses are unevenly distributed between regions, as are the water resources used. It is therefore important to contextualise the use of these figures and to consult the BNPE website to adapt them to the region in question.

    Assessment of the impact of abstraction on groundwater resources can be calculated using hydrodynamic models incorporating the hydrogeological properties of hydrosystems, climatic conditions and abstraction as parameters.

    The quality of the predictions made by these models depends on the availability of robust, verified data over sufficiently long periods to be able to reproduce the dynamics of the hydrosystem. Possession of abstraction data is essential if we are to understand their impact on aquifer levels, whatever the use.

    At present, the volumes abstracted, even though they are subject to declaration, are not sufficiently well known for each region and are only reported on an annual time scale in the National Water Abstraction Database (BNPE), which means that it is not possible to accurately forecast the impact of abstractions on a monthly scale.

    The 2006 Act on water and aquatic environments provided for a reform of the volumes that can be abstracted by human activity. Its aim is to adapt water abstraction to the available resources in each basin.

    The goal is to achieve a balance between water resources and the pressure on them, particularly in catchment areas located in water distribution zones (ZRE Zone de Répartition des Eaux), where water resources are chronically insufficient to meet user needs.

    This quantitative management of water resources is a global approach per catchment area (to match available resources with different uses) and is structured as follows:

    • For each catchment area, determination of the volume that can be abstracted per use and per period, i.e. the overall volume that the environment is capable of supplying while guaranteeing the proper functioning of aquatic environments.
    • Revision of abstraction authorisations so that the total volume of authorisations issued does not exceed the volume that can be abstracted.
    • In basins where the structural water deficit is closely tied to agricultural irrigation, collective management of agricultural abstractions is being set up under the aegis of the Prefects. The allocation of water volumes for agricultural use is gradually being entrusted to a single collective management body (OUGC - Organisme Unique de Gestion Collective). Each year, the OUGC allocates the overall volume defined between all irrigators within its perimeter.

    BRGM, as a scientific body with expertise in ground and subsurface sciences, develops the observation, analysis and modelling tools needed to study aquifer systems. These studies, which are generally based on the analysis of historical geological, hydro-geological, climatic and geochemical data, help to understand how hydro systems function and to provide projections of future trends so that the groundwater resource in question can be managed as effectively as possible.

    Restrictions on water use and solutions to deal with the drought

    Prefectural Orders restricting water use

    To deal with periods when there are is not enough water to go round, the Prefects can take exceptional, gradual and temporary measures to limit or suspend non-priority water uses for private individuals and professionals, according to 4 levels of severity: vigilance, alert, reinforced alert, crisis.

    • Vigilance: involves encouraging private individuals and professionals to save water (awareness level, no restrictions);
    • Alert: involves a reduction in all water abstraction and a ban on activities that affect aquatic environments, restrictions on watering gardens, filling and emptying swimming pools, washing vehicles and irrigating crops;
    • Reinforced alert: involves a reduction in all water abstraction and a ban on activities impacting aquatic environments, reinforced restrictions on watering gardens, filling and emptying swimming pools, washing vehicles and irrigating crops;
    • Crisis: this level is triggered to protect priority uses, prohibiting water abstraction for agriculture (totally or partially), for many domestic uses and for public spaces.

    Restriction orders are published on the website of the government departments concerned for the duration of the restriction period. They are also sent to the mayor of each municipality concerned for information purposes.

    This approach has proved its worth in previous years, and is part of a continuous improvement process. The drought guide for prefects and government departments has recently been updated.

    Data and models to support decision-making

    The implementation of restrictive measures is based on knowledge of resources and the development of prediction models.

    BRGM informs public decision-making by providing data on aquifer levels through the national piezometric monitoring network. It also provides projections of changes in aquifer levels on different time and space scales, using modelling tools based on the pressure exerted on the aquifers, and thus helps to define acceptable aquifer levels to preserve the corresponding aquatic environments while also meeting society's water needs.

    These tools include MétéEAU Nappes, which can be used to respond to requests over short periods and can be updated rapidly, and regional mesh models for longer-term predictions. To go further and take climate change scenarios into account, the AQUI-FR project, jointly undertaken by BRGM, CNRS, CERFACS, ENS, Géosciences-Rennes and Météo-France, incorporates models covering regional scales for a third of mainland France.

    Reducing abstraction has a positive impact on aquifer levels and corresponding aquatic environments (rivers, wetlands, etc.).

    To monitor and visualize the impact of usage restrictions on a body of water, it is necessary to control all the other parameters that allow it to be recharged or depleted.

    The example of July 2022 speaks for itself. According to the groundwater situation bulletin of 1 August 2022, during the summer low-water period, depletion continued in all aquifers in July 2022 and all their levels fell. This is normal, given the lack of rainfall (no rain at all over the whole country during July 2022). However, during this period, a slowdown in the depletion of many aquifers was observed, probably as a result of the decrease in abstractions following the application of restrictions on use.

    The drought guide published by the Ministry of Ecology recommends not anticipating situations and applying restrictions gradually. Restriction orders must reflect the actual hydrological situation on a case-by-case, region-by-region basis. The situation is reported to the government at hydrological anticipation and monitoring meetings (CASH - Comité d'Anticipation et de Suivi Hydrologique) and inter-Ministerial meetings (CIC - Cellule Interministérielle de Crise) by those involved in the Hydrological Situation Bulletin (BSH), including BRGM for aquifer monitoring.

    Of the 503 billion m3 of rain that falls on France every year (to which we must also add 11 billion m3 via the watercourses entering the country):

    • it is estimated that 314 billion m3 evaporate or are subject to evapotranspiration by plants,
    • 200 billion m3 of rainwater either infiltrates into aquifers (120 billion m3) or flows into watercourses (80 billion m3). This is the proportion of rainwater that has not evaporated, and is known as a region's renewable water resource.
    Diagram of the global water cycle.

    Diagram of the global water cycle.

    © BRGM

    Diagram of the terrestrial water cycle. © BRGM

    A large proportion of rainfall is not available for human use, as it is needed to maintain the proper functioning of aquatic environments, recharge groundwater and support the flora and fauna that depend on it.

    It is difficult to estimate the proportion of water infiltrated into aquifers, but this volume does not exceed 20 to 23% of annual rainfall. Moreover, groundwater reserves are only built up during the autumn and winter recharge periods, when temperatures are low and vegetation is dormant. Summer periods favour rapid evaporation and rainfall that does not recharge aquifers effectively.

    With these spatial and temporal dynamics, rainfall can be unevenly distributed, be abundant to different extents from one area to another and more or less effective in recharging aquifers, the level of which naturally falls in summer (depletion).

    In summer, the groundwater sustains the low-water flows of watercourses (the lowest water level in the year). In periods of high water-stress (high temperatures, strong demand for water), the depletion of aquifers and low water levels in rivers lead to a scarcity of water resources, which threatens the preservation of aquatic environments and their corresponding ecosystems, as well as the supply of drinking water. This is why restrictive measures are implemented.

    The indicators used for the groundwater situation bulletin and for the implementation of measures to restrict water use have different objectives: monitoring aquifer levels for one and managing water resources for the other.

    The groundwater situation bulletin published by BRGM is a monitoring tool that tracks monthly changes in groundwater reserves. It describes the quantitative situation of the aquifers. The groundwater situation indicator is based on a statistical analysis, which compares an average monthly piezometric level with those of the entire time series. An average monthly level can be statistically low, without being deemed to jeopardise priority uses (drinking water, health and safety) or to threaten interactions between the aquifer and surface water.

    Drought thresholds or groundwater resource management thresholds are specific piezometric levels (aquifer levels) that can be used to alert water management authorities so that they can then take steps to restrict use in the event of the onset of a critical situation that could generate conflicts of use or threaten the balance of the hydrosystem in question.

    These management thresholds are determined for one or more piezometers deemed to be representative of the basin in question and of the management objective. In most cases, the levels associated with drought thresholds are determined by analysing the piezometric record from a statistical point of view, taking into account the notion of "rarity" (e.g. return period of 10 years). In some cases, fairly detailed information on the harmful impacts of past droughts can be used to supplement these data and determine a threshold based on proven "consequences" (drying up of watercourses, disruption of the drinking water supply, intrusion of a salt-water wedge, etc.).

    The thresholds leading to water restriction measures are defined at local level by the Prefects. This system makes it easier to react in crisis situations and ensures transparency and consultation between the various users in the same basin. When a piezometer threshold is exceeded, the Préfet may issue an order restricting the use of groundwater. This decision is taken by the Prefecture, after consultations with government departments, experts, water professionals and stakeholders. It is possible that no restrictions on use will be put in place, despite a threshold being exceeded, for example if there is no use of groundwater in the basin during the period in question.

    BRGM has helped design methodologies for determining these thresholds, by exploring the steps required to set up piezometric indicators linked to the volumes abstracted.

    Fighting water scarcity requires action on two fronts:

    • Limiting the rise in temperature to also limit evaporation, which is in line with measures aimed at mitigating climate change.
    • The search for greater sobriety on the part of all users of water resources, to adjust the balance between demand and renewable resources.

    In addition, there are a number of technical solutions:

    • Soil unsealing (in rural and urban areas) to improve rainwater infiltration.
    • Controlled recharge of groundwater with surface water (if available) or non-conventional water (rainwater and treated wastewater).
    • Nature-based solutions.
    Eight types of nature-based solutions (SFN - Solutions Fondées sur la Nature) that can be used for sustainable groundwater management.

    Eight types of nature-based solutions (SFN - Solutions Fondées sur la Nature) that can be used for sustainable groundwater management.

    © BRGM

    Eight types of nature-based solutions (SFN - Solutions Fondées sur la Nature) that can be used for sustainable groundwater management. © BRGM

    These adaptations need to be thought through:

    • according to the specific characteristics of each region,
    • and with a view to the risk/benefit ratio.

    No, it is not possible to send water from one aquifer to another: the volumes of water that would have to be pumped and reinjected are too great.

    Chalk water table in the Centre Region

    Groundwater resources and databases in France

    France has very rich knowledge databases on groundwater. They are developed and managed by BRGM in cooperation with its partners.
    Map of aquifer levels in France on 1 April 2023

    BRGM's groundwater status report: a statistical vision over time

    BRGM, the French geological service, publishes its groundwater status report 10 times a year (once a month except for February and December); it provides an update on the quantitative status of aquifers. This status report compares the current month’s figures with those of the same months in the entire record, i.e., at least 15 years of data.

    Based on the levels provided by the piezometers of the national monitoring network, BRGM establishes level indicators to facilitate data interpretation. When a piezometer borehole has yielded at least 15 years of data, it is considered to be capable of establishing monthly averages and a standard deviation. A given aquifer will thus be considered to be high or low compared to the average for the same month over at least 15 years. This average itself evolves over time as it adds the levels of the previous year. The oldest records of the national piezometric network date back more than 100 years.

    Since 2017, the calculation used is based on the standardised piezometric indicator. It is consistent with the standardised precipitation indicator (IPS - indicateur standardisé des précipitations) developed by Météo-France, which facilitates comparison of the state of aquifers with climate episodes.

    Risk of drought affecting strategically important aquifers in 2023 - April 2023.

    Risk of drought affecting strategically important aquifers in 2023 - April 2023.

    © BRGM

    Seasonal forecasts and drought risk map

    Each month, Météo-France produces a report of major trends for the next three months. It is not a weather forecast to provide information on the expected weather in France on a given day, but to identify likelihood trends at the European level. These forecasts are used by BRGM to produce a projection of the state of aquifers, which is included in the monthly report on their actual state.

    In addition, BRGM has been producing a map of summer seasonal forecasts on the condition of aquifers since 2021. The drought risk map is based on the initial state of the aquifers after the winter recharge period, on seasonal forecasts from Météo-France, on seasonal forecasts from hydro-geological models and also on the expertise of BRGM regional hydro-geologists.

    Hydrological status report

    The national hydrological status report consists of a set of maps with corresponding comments that show the monthly evolution of water resources. It describes the quantitative situation of aquatic environments (effective rainfall, river discharge, groundwater table levels, reservoir/dam filling status) and provides summary information on Prefectural Orders issued to limit water use during the low-flow period.

    BRGM contributes to the groundwater section of the French Hydrological Status Report.

    ADES: the French portal for access to data on groundwater in France

    BRGM has set up a database and a corresponding website, which is accessible to all water stakeholders but also to the general public: ADES. It brings together quantitative and qualitative data on groundwater in mainland France and the overseas departments, obtained from thousands of French piezometric boreholes and tens of thousands of wells used to monitor groundwater quality. ADES is a major communication and management tool for groundwater monitoring, which provides easily accessible data.
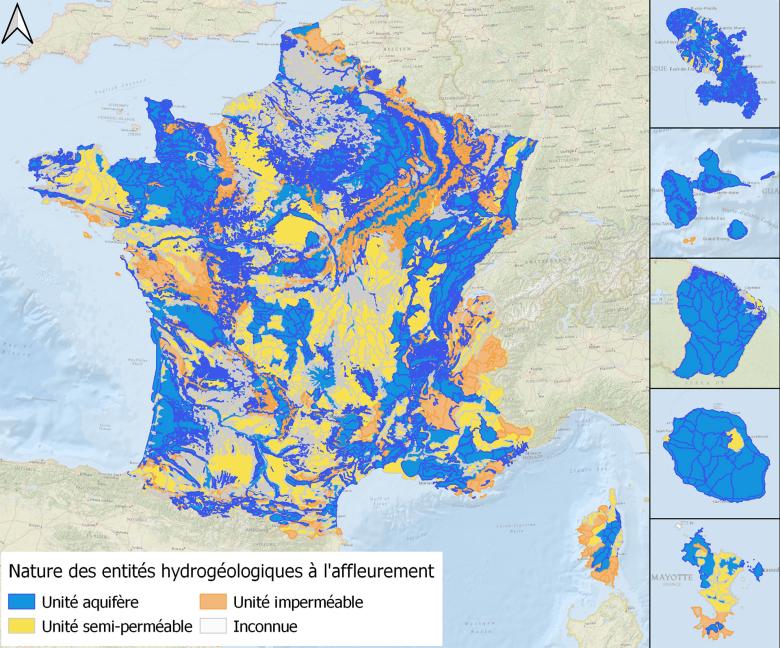
    Map of outcropping hydrogeological entities, classified by type, in Version 3 of BDLISA, the French hydrogeological database.

    Map of outcropping hydrogeological entities, classified by type, in Version 3 of BDLISA, the French hydrogeological database.

    © BRGM

    BDLISA, the French hydro-geological repository

    To facilitate access to knowledge of the state of aquifers, and to enable better management of the resource by government departments and local authorities, BRGM has conducted a vast project over the last 10 years to unify the data in a constantly evolving repository: the Aquifer Systems Limits Database (BDLISA - Base de Données des Limites des Systèmes Aquifères). This is the cartographic repository of the water information system. It provides a spatial overview of the major groundwater bodies in France. Its use requires training which BRGM provides at its headquarters in Orléans.

    The BDLISA repository can be used to define the aquifers to be reserved for drinking water supply in the event of a water shortage, to identify the causes of a flood by revealing the possible role of groundwater (overflow), to determine the risk of marine intrusion into the groundwater in coastal areas, or to study the technical and economic feasibility of an artificial recharge solution.

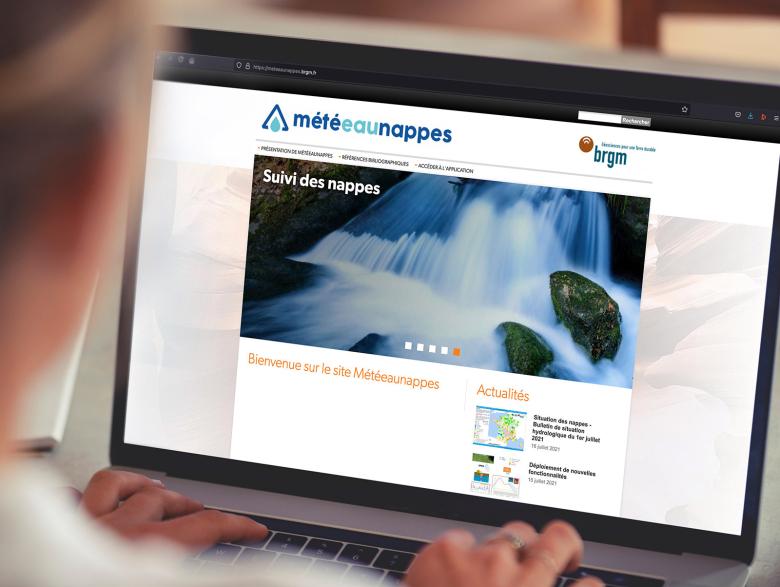
    Website home page MétéEAU Nappes.

    Website home page MétéEAU Nappes.

    © BRGM

    MétéEAU Nappes, a tool for the real-time monitoring and forecasting of aquifer levels

    BRGM has developed the MétéEAU Nappes website, which displays real-time data of measurements carried out by the national piezometric network, for various monitoring points linked to the global hydrological model.

    These data are displayed as maps and dynamic graphs based on modelling and forecasting of water table levels during low- and high-water periods. Meteorological, hydrological and piezometric data from 13 representative sites in mainland France are published on-line in real time. Combined with the general models used (Gardenia and Tempo ©BRGM), these data are used to forecast aquifer levels. The forecasts (which cover 6 months) are compared with piezometric thresholds (for example: drought thresholds taken from Prefectural decrees concerning restrictions on water use).

    MétéEAU Nappes provides a whole range of services that enable users to monitor the current and future behaviour of aquifers in France. It is a practical decision-support tool for managing water resources in sensitive areas (management of low flow in rivers, risk of flooding due to rising water tables, etc.).
    Other public information sites and applications on groundwater in France